How A/E Firms identify Their Most Profitable Projects and Clients
You can use your data to identify your best clients and projects based on performance and profits. Here is a quick and easy analysis you can do.
How to Identify Your Most Profitable Clients and Projects
Most firms don’t have a revenue problem.
They have a fit problem.
They take on projects that look good on paper—but quietly underperform. Low margins. Too many meetings. Too much scope creep. Too much friction.
The result:
- Revenue goes up
- Profit doesn’t
This is where segmentation and analytics change everything.
By the end of this, you should be able to answer one question with precision:
Which clients and project types actually make you money—and which ones don’t?
The Metrics That Actually Matter
You don’t need 20 KPIs. You need a few that tell the truth.
1. Net Revenue
How much revenue are you generating by:
- Client type
- Project type
- Segment
This tells you where your top-line is coming from.
2. Net Multiplier
Your core performance metric:
- Revenue ÷ Direct Labor
Rule of thumb:
- 3.0+ = healthy
- Below 3.0 = needs attention
This tells you:
How many dollars you generate for every dollar of labor.
3. Profit & Profit Percentage
This is where most firms get surprised.
- Profit (absolute dollars)
- Profit % (as a % of net revenue)
This tells you:
Which work is actually worth doing.
4. Net Multiplier vs. Breakeven
Breakeven = 1 + Overhead Factor
So if your overhead factor is 1.65:
- Breakeven = 2.65
Now compare:
- Net Multiplier – Breakeven
Result:
- Positive → profitable
- Negative → losing money
No interpretation needed.
Where to Segment Your Data (This Is the Real Lever)
Most firms stop at “project-level reporting.”
That’s not enough.
You need to slice performance across meaningful segments.
1. Project / Building Type
Examples:
- Office
- Retail
- K-12
- Medical
- Religious
What to look for:
- % of revenue vs % of profit
- Profit margins by type
Example insight:
- Barbershops = 9% revenue, 15% profit, 30% margin → double down
- Churches = 17% revenue, 8% profit, 8% margin → question the fit
2. Funding Source
Break it down further:
- Private (developer vs nonprofit)
- Federal
- State
- School district
- City / County
This often reveals structural issues:
- Fee constraints
- Excessive oversight
- Administrative burden
You may find:
- Federal work underperforms consistently
- School districts perform well
That’s not random—that’s a strategy signal.
3. Delivery Method
How the work is delivered:
- Design-bid-build
- Design-build
- Design assist
- Feasibility / studies
Some firms unknowingly make more money on:
- Faster cycles
- Less fragmentation
- Better collaboration
4. Client Type
Not just “client vs non-client.”
Break it into:
- Owner
- Developer
- Public agency
- Architect / engineer (subconsultant)
You’re looking for:
Who you perform best for—not just who hires you most.
5. Project Manager
This is where it gets uncomfortable—but useful.
- Who consistently delivers strong margins?
- Who struggles?
This is rarely just a “people problem.” It’s usually:
- Project mix
- Support structure
- Experience level
But you won’t know until you measure it.
6. Geography / Region
Simple question:
- Do you perform better locally or remotely?
Some firms find:
- Travel kills margin
- Local relationships improve efficiency
Others find the opposite.
The Most Powerful View: Cross-Segmentation
This is where pivot tables become strategic.
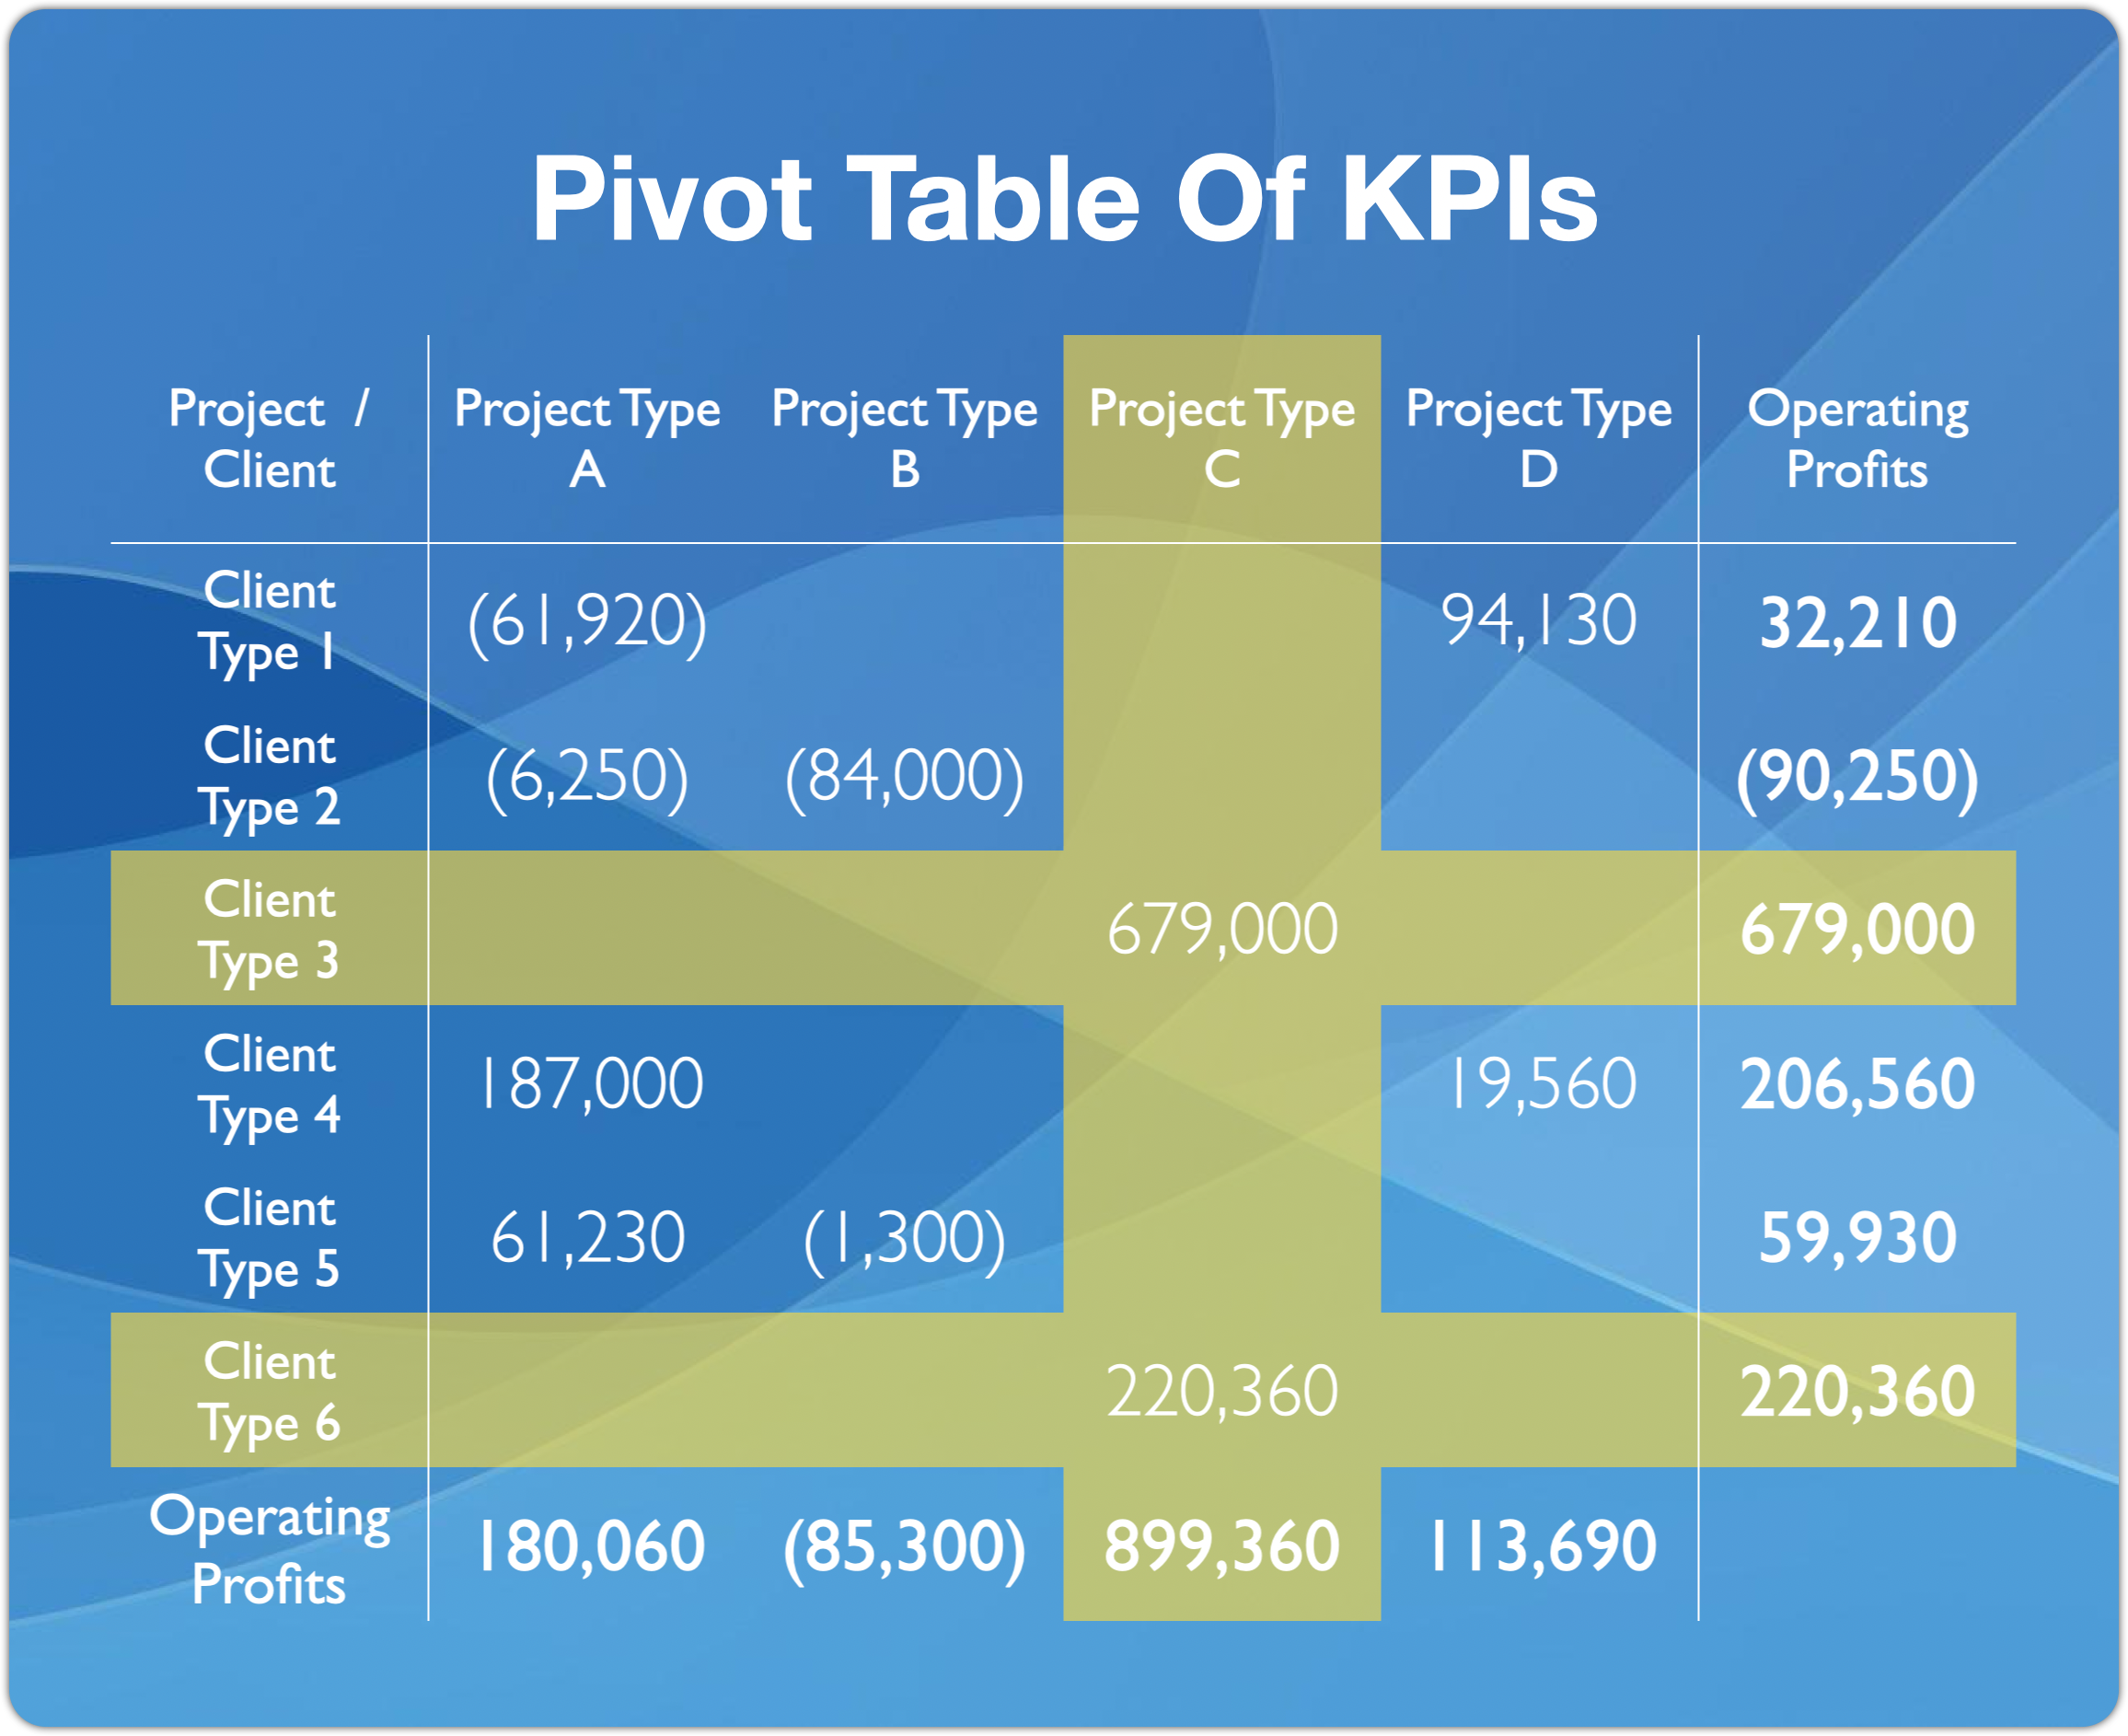
Now you can see:
- Where performance clusters
- Where your “sweet spots” actually are
This is how you move from:
“We think we’re good at this…”
to:
“This is objectively our most profitable niche.”
What To Do With This Information
This is where most firms fall short.
They analyze—but don’t act.
Step 1: Double Down on Winners
- Pursue more of these projects
- Market specifically to these segments
- Build expertise in that niche
If K-12 + architects is your sweet spot:
- Join associations
- Attend conferences
- Speak their language
Become known for it.
Step 2: Fix or Eliminate Losers
For underperforming segments:
- Identify why (fees, staffing, process, scope)
- Try to fix it
If it can’t be fixed:
- Stop pursuing it
This is the part most firms avoid.
Step 3: Replicate What Works
Look at your best-performing work and ask:
- What’s different?
- Staffing?
- Client behavior?
- Project structure?
Then apply those patterns elsewhere.
The Real Outcome
When firms do this well, the shift is significant:
- Less chasing bad-fit work
- Higher margins without raising fees
- More predictable profitability
One firm discovered:
- Best: design-build office projects
- Worst: plan/spec religious projects
They adjusted the pursuit strategy accordingly.
Revenue didn’t just improve.
Profitability stabilized.
Final Take
Most firms think growth comes from doing more work.
In reality, it comes from doing the right work.
If you’re not segmenting your projects and clients, you’re guessing.
And guessing is expensive.
Most firms try to do this analysis in spreadsheets.
It breaks quickly:
- Data is fragmented
- Labor and revenue don’t align cleanly
- Segmentation becomes manual
What you need is:
- Real-time net revenue
- True net multiplier (with labor tied correctly)
- Built-in segmentation across projects, clients, and phases
Jump back to Our Best Practices Hub
Rocket Billing™️ cuts billing time by 60%
Rocket Billing™ automatically generates draft invoices from earned value and WIP.
• Launch the rocket.
• Review the invoices.
• Send them out. Piece of cake.
Firms routinely generate
dozens of invoices in minutes.
Get Fully Onboarded in 7 Business Days
Our team is ready to guide you from where you are to where you want to be. Give up managerial minutia for the freedom to focus on the work you do best.

BaseBuilders’ easy-to-use software is specifically designed to help small to mid-sized firms track time, manage projects, stay on top of expenses, and more. We’ll handle the invoicing for you so you can focus on growing your firm and designing wonderful spaces.